Choosing an air purifier can feel overwhelming. Every brand highlights different features; sensors, modes, filters, apps. However, not all of them actually improve your air quality in a meaningful way.
At its core, an air purifier does one job: move air through a filter and remove particles. How well it does that depends far more on airflow and filter quality than flashy features.
This guide breaks down the features that genuinely matter when choosing an air purifier for NZ homes. We'll also show you where it’s easy to be misled by specs that look good on paper but don’t translate to cleaner air.
Table of contents
1. HEPA Filtration: The Foundation of Clean Air 2. Carbon Filters: Odours, VOCs & Why Weight Matters 3. CADR: The Most Important Number on the Spec Sheet 4. Sizing a Purifier Properly: CADR, Room Size & Noise i. Why Manufacturer Room Size Claims Can Be Confusing ii. Noise levels: What to look for in real use 5. Extra features: what to be cautious of (and why) Ionisers (negative ion/plasma modes) UV Lights Auto modes and built-in sensors Wi-Fi and app control (nice to have, not essential) 6. Wrap-up: Focus on the simple features Looking for an air purifier that ticks all the boxes?
Quick guide: what actually matters
HEPA filtration matters more than fancy features
CADR (airflow) is the most important performance number
Room size claims vary, CADR makes comparison easier
Bigger units can run quieter on lower speeds
Carbon filters only help if they use real carbon pellets
Ionisers and “active” tech often add complexity, not performance
1. HEPA Filtration: The Foundation of Clean Air
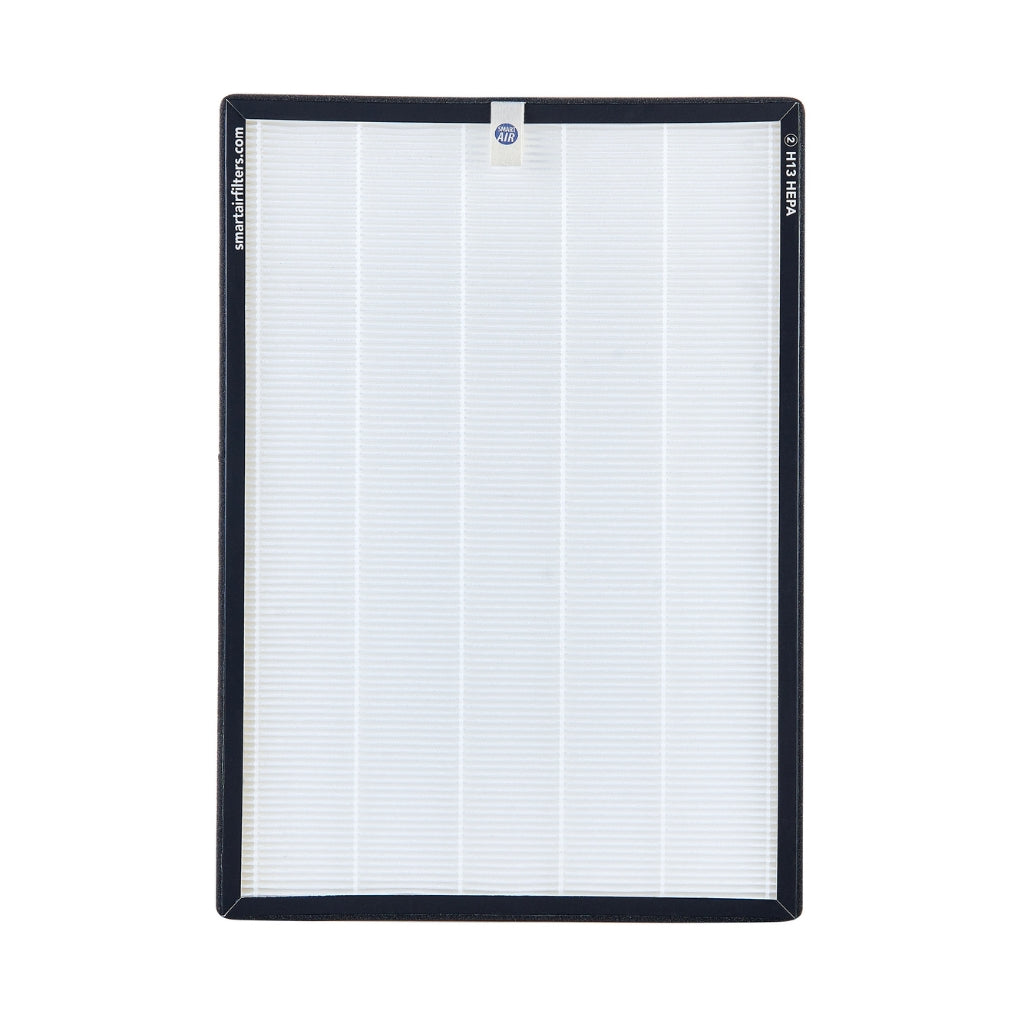
HEPA filtration is the most important part of any effective air purifier.
A HEPA filter works by physically trapping fine particles as air passes through it. These include dust, pollen, smoke, PM2.5 and many airborne allergens. These are the particles most commonly linked to respiratory issues and poor indoor air quality.
HEPA grades and what really matters
You’ll often see H13 promoted as the gold standard, and it is excellent. But lower grades like H12 and even H11 can still perform extremely well, provided the purifier has high CADR.
A slightly lower-grade HEPA filter moving a lot of air will outperform a higher-grade filter with weaker airflow.
What matters most is:
HEPA filtration (not “HEPA-like” or proprietary names)
Enough airflow to cycle the room regularly
Avoid vague terms like:
“HEPA-style”
“HEPA-type”
If a manufacturer won’t clearly state the HEPA grade, it’s usually a red flag.
2. Carbon Filters: Odours, VOCs & Why Weight Matters
Carbon filtration plays a different role to HEPA.
While HEPA filters remove particles, activated carbon helps absorb gases and odours, such as:
Cooking smells
Smoke odours
Chemical fumes
VOCs from furniture, paints or cleaning products
Not all carbon filters are equal
Many air purifiers advertise carbon or VOC filtration, but include only a thin carbon-coated sheet. These filters saturate quickly and have limited ability to absorb gases.
What actually makes carbon effective:
Carbon pellets or granules, not just a coating
More carbon weight, which increases effectiveness and lifespan
A light carbon layer may slightly reduce smells, but it won’t meaningfully address ongoing odours or VOCs.
Carbon filtration is optional for many homes.
If particles are the main concern, HEPA does the heavy lifting.
3. CADR: The Most Important Number on the Spec Sheet
If there’s one specification to pay attention to when choosing an air purifier, it’s CADR (Clean Air Delivery Rate). CADR tells you how much clean, filtered air a purifier can deliver per hour. In simple terms, it measures how quickly a purifier can remove particles like dust, pollen and PM2.5 from a room.
Higher CADR means:
Faster removal of particles
Better performance in larger rooms
More flexibility to run at lower, quieter speeds
A purifier with high CADR will always outperform a weaker one in real-world use.
4. Sizing a Purifier Properly: CADR, Room Size & Noise
Most people start by thinking about the size of the room, which is exactly the right place to begin.
A simple, practical rule of thumb is:
Multiply your room size (m²) by 7.5 to estimate the CADR (m³/h) you need
This gives you a target CADR that will deliver around 3 air changes per hour in a standard-height room.
Example:
20 m² bedroom × 7.5 = 150 m³/h CADR required
65 m² living area × 7.5 = 488 m³/h CADR required
This approach makes it much easier to compare purifiers objectively.
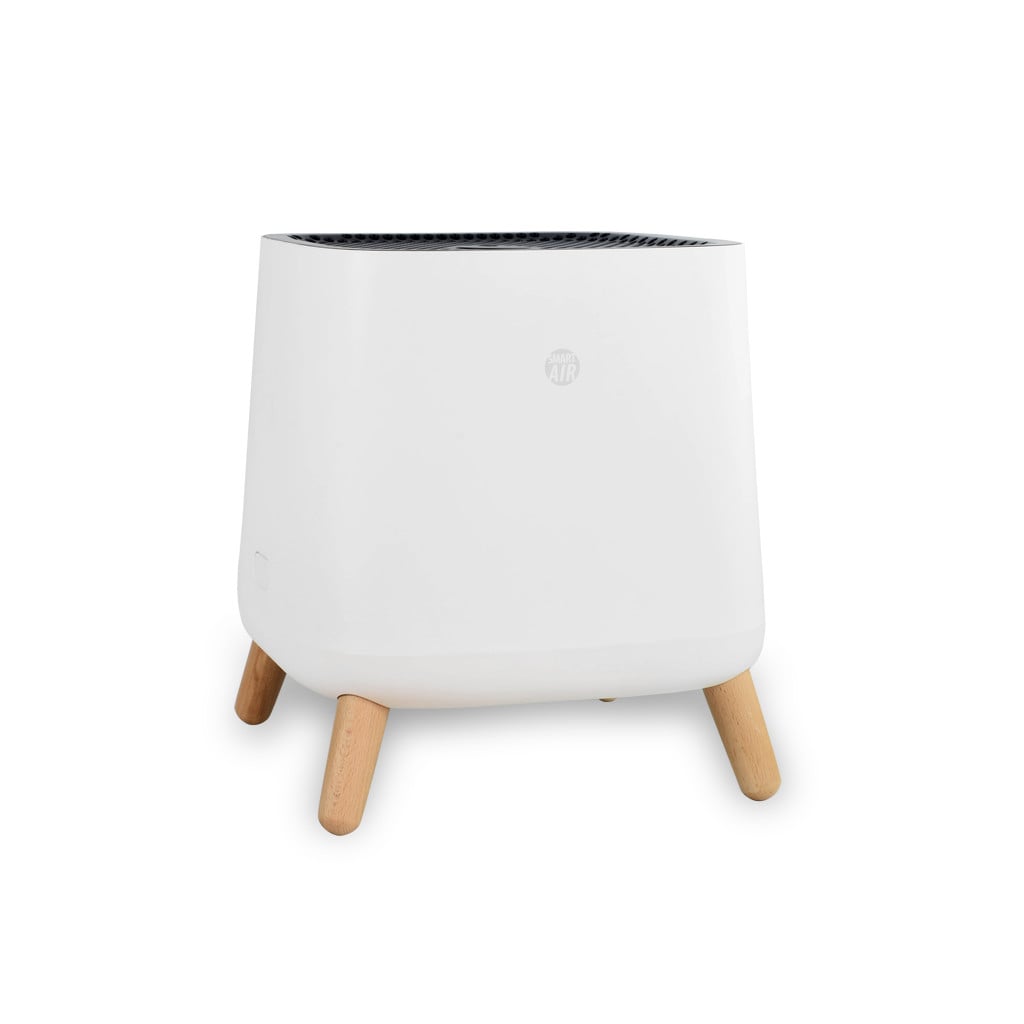
Need 500+ CADR? High power, and perfect for rooms up to 65m²
Key features:
Runs as quiet as 16 dB on low, suitable for bedroom usage
Scales up to cover living areas up to around 65 m²
Reaches 51 dB at full power when maximum airflow is needed
Uses true HEPA filtration for dust, pollen and PM2.5
Includes a built-in carbon filter for everyday odours
No ionisers or ozone-producing technologies
Shop Smart Air SA600
i. Why Manufacturer Room Size Claims Can Be Confusing
You’ll often see air purifiers in NZ advertised with room size ratings that don’t line up with this rule at all. That’s because:
There is no single standard for how room size is calculated
Some ratings assume very low air changes per hour (even less than 1!)
As a result, two purifiers both advertised for “40m² rooms" can perform very differently in practice. Looking at CADR lets you cut through this and compare models on equal footing.
ii. Noise levels: What to look for in real use
Noise matters because air purifiers work best when they run for long periods, not just short bursts.
Living rooms, offices and daytime use
In shared or daytime spaces, a bit of background noise is usually acceptable if it means better air cleaning.
As a general guide:
Around 50 dB is typically fine
TVs, conversation and appliances often mask purifier noise
Medium fan speeds often give the best balance of airflow and noise
Bedrooms and overnight use
In bedrooms, purifiers often run for long periods while you sleep, so lower noise becomes much more important.
As a guide:
Under 30 dB is ideal for overnight use
Lower is better if you are noise-sensitive
Avoid any with lights that may be distracting
Learn More About Air Purifiers & Sleep
What to be aware of for real-world quiet performance:
Some brands only quote noise at the lowest fan speed
That lowest speed may deliver very little CADR
Quiet on paper doesn’t always mean effective in practice
Important:
What matters is how much CADR the purifier delivers at a quiet setting, not just the decibel number.
A well-sized purifier can often deliver enough airflow for a bedroom at around 16–25 dB, allowing it to run all night without disturbance.
5. Extra features: what to be cautious of (and why)
Many air purifiers include additional features that sound appealing; UV lights, ionisers, smart sensors, Wi-Fi apps and automatic modes.
Some of these can be useful in the right context, but many don’t meaningfully improve air cleaning for most homes. This doesn’t mean these features are “bad”, but it’s worth understanding what they do, and what they don’t.
Common features that don't always help:
Ionisers or negative ion generators
UV lights
Auto modes based on built in sensors
App control and Wi-Fi connectivity
Ionisers (negative ion/plasma modes)
Ionisers (sometimes called negative ion or plasma technologies) work by electrically charging particles in the air so they clump together or settle onto nearby surfaces.
This can make particle levels drop faster in CADR lab tests, but it doesn’t necessarily mean those particles are being removed from your environment. In real homes, they can end up on floors, furniture, or walls instead of being trapped in the filter.
Because of this, ionisers can make performance numbers look better without improving actual filtration. Some ionising technologies can also produce small amounts of ozone as a by-product, which is why many people prefer not to introduce additional substances into their indoor air.
Learn More About Ionisers
Important:
Some purifiers allow the ioniser to be switched off (which we'd recommend), but manufacturers rarely publish the CADR with the ioniser disabled. That makes it difficult to know the purifier’s true, filter-only performance.
UV Lights
UV lights are often marketed as a way to neutralise bacteria and viruses in the air. In most consumer air purifiers, however, air normally passes the UV source too quickly for meaningful disinfection to occur.
It’s also worth noting that HEPA filtration already captures the vast majority of airborne particles, including dust, pollen, PM2.5, and virus-containing aerosols. For everyday indoor air quality, a well-sized HEPA purifier is already doing the most important part of the job.
UV tends to add cost and complexity without improving real-world air cleaning in most homes.
Auto modes and built-in sensors
Automatic modes sound convenient, but how effective they are depends heavily on the quality of the sensor and where it’s located inside the purifier.
Things to be aware of:
Built-in sensors vary widely in accuracy
Many use very low-cost sensors that can be unreliable
Readings are taken at a single point, where the air is cleanest on the purifier
Air quality can be poor without triggering a noticeable fan response
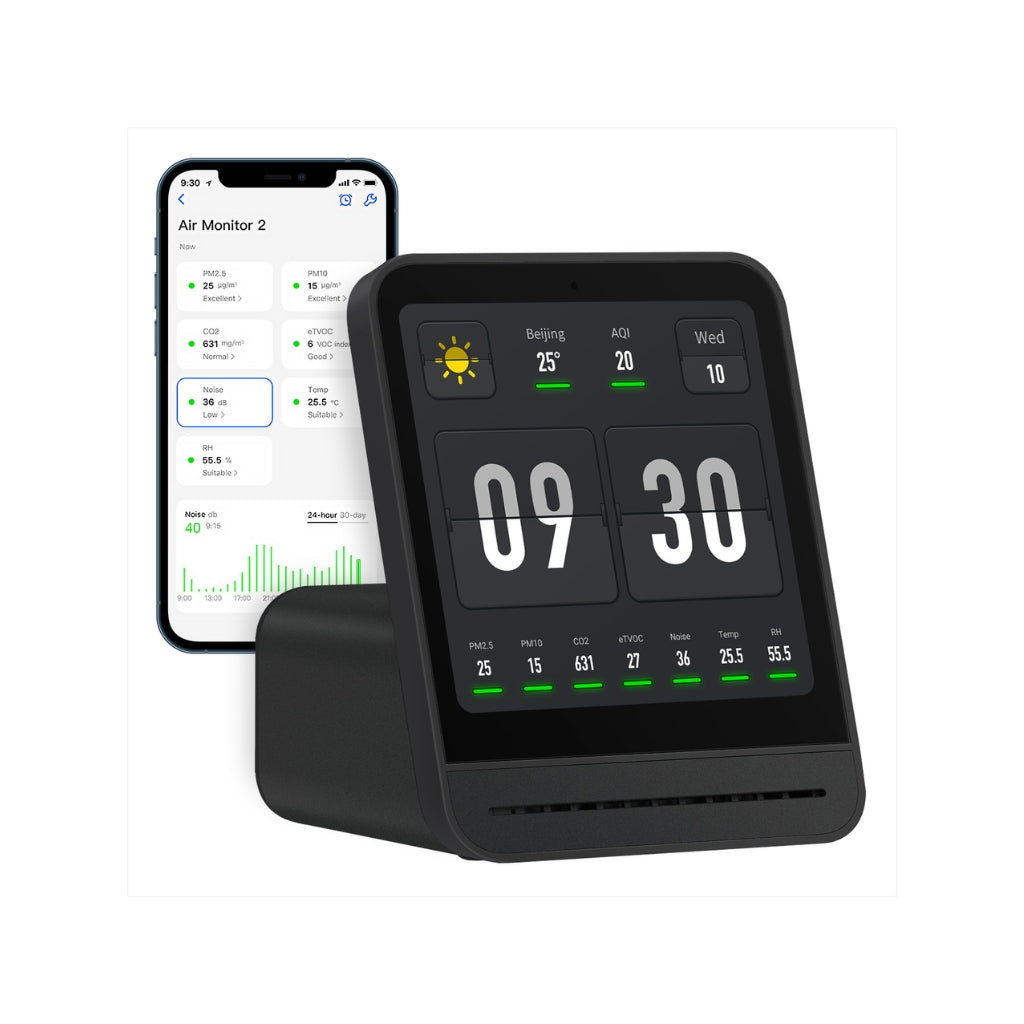
Because of this, an auto mode may leave the purifier running slowly even when air quality isn’t ideal. Many people prefer to run purifiers at a consistent manual speed, or use a separate, dedicated air quality monitor for better insight.
Wi-Fi and app control (nice to have, not essential)
Wi-Fi and app control can be convenient, but they don’t make a purifier clean the air any better. They also tend to add:
Extra cost
More complexity
Another system that can fail or become unsupported over time
The need to create and manage yet another app or account
For many people, this ends up being a feature that’s rarely used after the initial setup.
Our purifiers don’t rely on Wi-Fi or apps, but they work well with a simple Wi-Fi smart plug if you want basic scheduling or remote on/off control, without the complexity.
6. Wrap-up: Focus on the simple features
Choosing an air purifier doesn’t need to be complicated. Most of the real-world performance comes down to a few core factors, not a long list of extra features. If you focus on:
Proper HEPA filtration
Enough CADR for your room size
Noise levels that suit how you’ll actually use it
You’ll usually get better results than chasing advanced modes or add-ons that look good on a spec sheet but don’t improve day-to-day air cleaning.
Simple, well-sized purifiers that move plenty of air through a good filter tend to be quieter, more predictable, and easier to live with over the long term.
Looking for an air purifier that ticks all the boxes?
Explore HEPA air purifiers designed for real NZ homes. Quiet enough for bedrooms, powerful enough for living spaces, and free from unnecessary gimmicks.
See Product
See Product
Is a higher HEPA grade always better?
Higher HEPA grades (like H13/H14) are most critical in settings such as hospitals, clean rooms, or labs, where air may only get a single pass through the filter. In homes, air is continuously recirculated, so airflow (CADR) and regular air changes often matter more than filter grade alone. Well-designed purifiers using H12 or even H11 filters can perform extremely well when paired with sufficient airflow.
How many air changes per hour should I aim for?
As a baseline, we generally recommend at least 3 air changes per hour for homes. In busier or higher-risk environments, such as schools, offices, clinics, or shared spaces, this is often increased to 4–6 air changes per hour, depending on activity levels and occupancy.
Are ionisers or UV lights needed for everyday use?
For most homes, no. A properly sized HEPA purifier already captures fine particles, including smoke and virus-containing aerosols. Extra technologies may sound reassuring but often add cost and complexity without improving everyday air cleaning.
Should I rely on auto mode or control the purifier manually?
Auto modes can be convenient, but their effectiveness depends on sensor quality and placement. In many cases, running a purifier at a consistent manual speed that delivers enough airflow for the room provides more predictable results.
Relevant Articles:
The Best Air Purifiers in New Zealand: 2025 Comparison
Read more
Ionisers Explained: Why We Don’t Use Them (and Why Some Brands Do)
Read more
The Misleading Room Size Claims of Air Purifier Brands
Read more


